Cost-Efficient Databricks Monitoring for UK Enterprise Workloads
Databricks has become a central platform for UK enterprises, modernising analytics, AI, and data engineering. Its elasticity, scalability, and support for advanced workloads make it ideal for hybrid data stacks spanning cloud, legacy systems, and regulatory environments.
But as adoption grows, a new concern emerges across UK organisations:
How do we maintain performance while controlling Databricks costs?
Unlike traditional data platforms, inefficiencies in Databricks rarely result in system failure. They result in rising DBU consumption, unpredictable runtimes, and growing infrastructure bills, often without obvious warning signs.
Cost-efficient monitoring is therefore not just an optimisation exercise. It is becoming a core discipline in enterprise data operations.
Why Databricks Costs Behave Differently
In traditional infrastructure, capacity is fixed. In Databricks, compute is elastic.
Clusters scale. Workloads evolve. Data volumes increase. Queries change. Auto-scaling ensures jobs finish, but this flexibility also masks inefficiencies.
What teams see:
- Jobs still succeed
- Dashboards still update
- Pipelines still run
What they don’t immediately see:
- The same job using more DBUs month over month
- Runtime variance increasing
- Clusters scaling more frequently
- Small inefficiencies compounding into material cost growth
In many UK enterprises, the first signal of trouble appears not in engineering dashboards, but in FinOps or finance reviews.
The Hidden Drivers of Databricks Cost Instability
1. Gradual Workload Expansion
As organisations mature their analytics:
- New features are added to pipelines
- ML training logic expands
- Additional joins and transformations accumulate
Each change is logical. Over time, however, these incremental additions alter execution plans and increase DBU consumption.
No single change looks alarming. The combined effect does.
2. Data Volume and Distribution Changes
UK enterprises often integrate new data sources, regulatory datasets, or operational feeds. As volumes grow:
- Shuffles become heavier
- Skew increases
- Partition strategies degrade
Spark adapts, but compute demand rises, often invisibly.
3. Auto-Scaling as a Cost Blind Spot
Auto-scaling ensures reliability, but it also:
- Hides performance regressions
- Prevents resource-related failures
- Converts inefficiencies into higher DBU usage
Jobs finish successfully, yet clusters scale more aggressively to compensate.
4. Runtime Volatility
Unstable runtimes lead to:
- Inefficient scheduling
- Downstream delays
- Over-provisioned clusters “just in case”
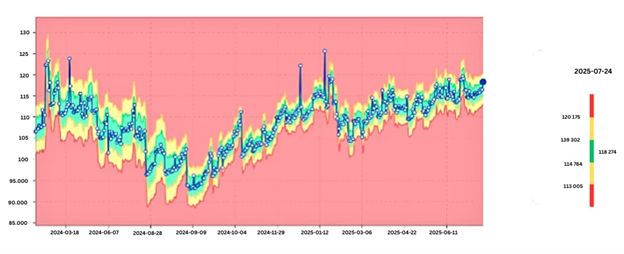
Volatility is often an early sign that execution plans, data distributions, or resource patterns are drifting.
Why Traditional Monitoring Falls Short
Most monitoring focuses on:
- Job success/failure
- Cluster health
- Daily cost totals
These views are important but retrospective. They do not show:
- Which jobs are becoming more expensive
- Whether runtime behaviour is changing
- Which workloads exhibit rising volatility
By the time cost dashboards show a problem, inefficiencies have already accumulated.
What Cost-Efficient Monitoring Really Means
Cost-efficient monitoring shifts the focus from static thresholds to behavioural analysis over time.
Key questions change from:
“Did this job fail?”
to:
“Is this job still behaving like it used to?”
This requires analysing time-series signals such as:
- DBU usage trends
- Runtime evolution
- Variance in task duration
- Cluster scaling behaviour
Detecting Cost Drift Early
Learning Normal Behaviour
Modern approaches model normal behaviour for each job or workload. Over time, stable patterns emerge.
As stability increases, acceptable ranges narrow.
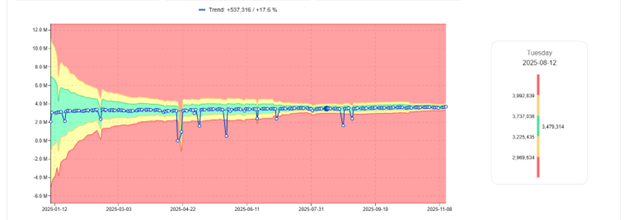
Normal DBU band tightening over time
Identifying Gradual DBU Growth
One of the most valuable insights for UK FinOps teams is identifying:
Which jobs have increased DBU consumption the most over the past month or quarter.
This highlights optimisation candidates before costs escalate.
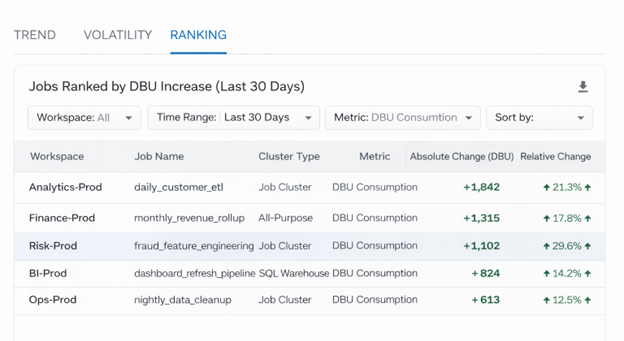
Jobs ranked by DBU growth
Measuring Volatility
Volatility signals unpredictability. Jobs with rising variance in runtime or DBU usage often:
- Experience skew
- Have inefficient joins
- Contain logic drift
Stability is not only about performance — it is about cost predictability.
Where digna Adds Value
Platforms such as digna apply AI-based anomaly detection to workload metrics, learning normal patterns and flagging deviations that appear implausible — whether sudden spikes or gradual drift.
Because the focus is behavioural rather than rule-based, teams gain early visibility into cost-driving instability without manually defining thresholds.
Why This Matters for UK Enterprises
UK organisations operate under:
- Cost pressure
- Regulatory oversight
- Hybrid architectures
- Rapid AI adoption
In this context, inefficient workloads are not just technical issues, they are governance and financial concerns.
Cost-efficient Databricks monitoring enables:
- Predictable budgeting
- Faster optimisation cycles
- Reduced firefighting
- Stronger alignment between data engineering and FinOps
Final Thoughts
Databricks does not fail when workloads become inefficient. It scales.
That scalability is powerful, but without behavioural monitoring, it can conceal growing instability and cost drift.
Enterprises that monitor workload behaviour, not just job outcomes, gain early control, ensuring that performance, reliability, and cost efficiency evolve together.